
Sea level rise could be even worse than previously thought for some unlucky coastal communities, as scientists uncover a massive difference in local tides.
Satellite images have revealed that tides can vary by almost a metre across the length of a single bay.
This means that some parts of the coast are at far greater risk of coastal flooding, saltwater intrusion, and pollution spills than their nearby neighbours.
Study co–author Dr Thomas Monahan, of the University of Oxford, told the Daily Mail: ‘A major challenge along the coasts is flooding, and this can be exacerbated by ocean tides.
‘Given the sharp variations of tides over short distances, this means that for the same storm, two neighbouring locations may have very different levels of flooding.
‘As we design future coastal infrastructure, accounting for these hyper–local variations will be essential for keeping communities safe.’
The study comes after a damning report from the American Meteorological Society (AMS) warned that Earth’s sea levels are rising to record heights due to climate change.
Global sea levels have now reached a record high for the 14th consecutive year, standing around 111 millimetres above the 1993 average when satellite measurements began.
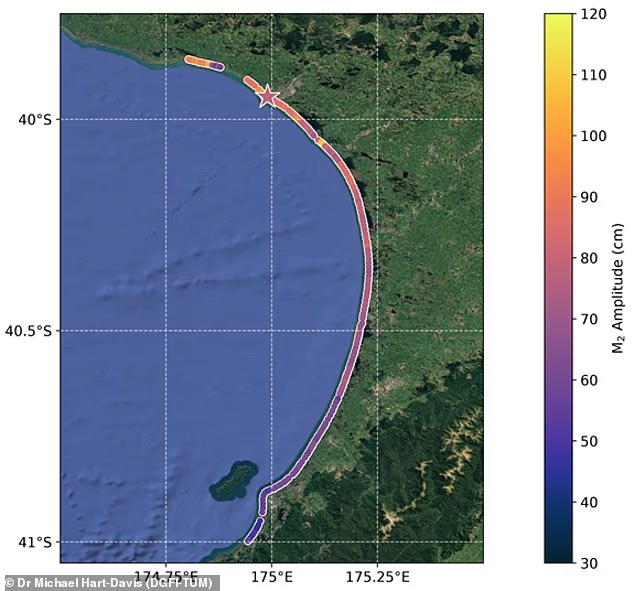
Satellite images have revealed that tides can vary by almost a metre across the length of a single bay. Pictured: Tidal variations in New Zealand’s South Taranaki Bight

Around Christchurch, New Zealand, tides to the east of the city were 40 centimetres higher than those to the south
Understanding tide levels is critical for modelling the risk of coastal flooding because these natural patterns can combine with other factors to trigger ‘compound flooding’.
Co–author Dr Michael Hart–Davis, of the Deutsches Geodätisches Forschungsinstitut, told the Daily Mail: ‘If you have a high tide at the time of a storm, there is a higher chance of a flooding event occurring, while the opposite may reduce the impacts of a storm.’
However, scientists’ understanding of how tides vary is currently extremely limited.
Tide gauges provide accurate measurements but only for one specific location, while conventional satellites using radar have limited range and a resolution that is typically in the tens of kilometres.
To get a clearer view of how the tides really affect the coast, the scientists developed a new technique that uses images taken by satellites instead.
Instead of estimating the height of the sea directly from the photos, this method uses the beach itself like a massive ruler.
As the tide rises and falls, the waterline moves up and down the sloping beach and satellite images record where that waterline sits.
Using information about the slope of the beach, researchers can translate that information into data about changes in sea level.

Scientists warn that these hyper–local variations could mean that some areas are at risk of flooding while their nearby neighbours are safe
Repeated over hundreds of observations from the last 40 years of satellite records, the researchers have created a detailed picture of sea level rises that is accurate down to a scale of just 100 metres.
Applying the method across countries bordering the Pacific Ocean, the researchers were able to find massive tide variations within individual beaches.
In New Zealand’s South Taranaki Bight, for instance, the researchers found that tides varied by a little under one metre across the 56–mile (90km) bay.
Meanwhile, around Christchurch, New Zealand, tides to the east of the city were 15.7 inches (40cm) higher than those to the south.
The exact reason for these differences depends on the location, but they are generally caused by the combination of changes in ocean depth and the shape of the coastline.
With sea levels expected to continue rising due to climate change, the researchers warn that these differences will have big consequences for flood risks.
That increase is due to a combination of the water expanding as it gets warmer, and freshwater ice sheets melting and running off into the ocean.
The AMS estimates that warming oceans have contributed around 1.6 millimetres per year to sea–level rise since 2005, while melting glaciers and ice sheets have added a further two millimetres per year on average.


As sea levels rise, differences in tidal ranges could have a major impact on where flooding occurs across entire countries and on individual beaches. Pictured: Tidal variations in North (left) and South (right) America
Likewise, a recent study estimates that glaciers outside the vast ice sheets of Greenland and Antarctica contain around 150,000 cubic kilometres of ice.
If every one of these glaciers melted completely, it would raise global sea levels by more than 12in (32.3cm).
Dr Hart–Davis says: ‘When we talk about sea level rise impacts, the static sea level alone rarely causes immediate coastal flooding. Instead, it is the variations on top of this baseline that produce flooding.
‘Our results show that the tidal variability on top varies significantly over short distances. That means that when you add sea level rise into the equation, the impacts, including flood duration and magnitude, will not be uniform.’
With 40 years of satellite observations in the record, the researchers hope they can use their new technique to study how the tides have changed with rising sea levels.
By applying that method to beaches around the world, they could produce better predictions for exactly when and where flooding will strike.


