From historic homes in Edinburgh to towering skyscrapers in Shanghai, you can now explore every building in the world from the comfort of your home.
An incredible new map charts the location and size of 2.75 billion buildings in incredible 3D detail.
Dubbed the GlobalBuildingAtlas, it contains over a billion more houses than the previous biggest dataset.
And you can use it for yourself by using the interactive map below.
The GlobalBuildingAtlas was created by researchers from the Technical University of Munich (TUM) in Germany using a vast trove of satellite data.
The scientists combined nearly 800,000 satellite images captured in 2019 with an AI algorithm to predict the size of missing buildings based on the heights of the neighbours.
Lead author Professor Xiaoxiang Zhu says: ‘3D building information provides a much more accurate picture of urbanization and poverty than traditional 2D maps.
‘With 3D models, we see not only the footprint but also the volume of each building, enabling far more precise insights into living conditions.’
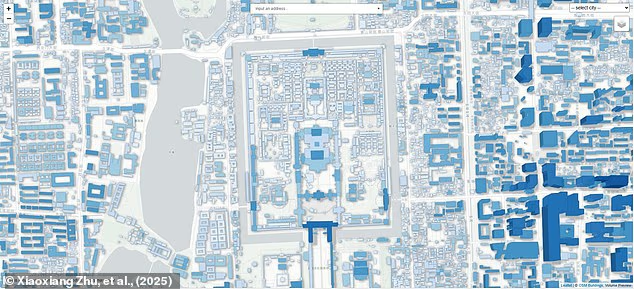
An incredible new map charts the location and size of 2.75 billion buildings in incredible 3D detail. Pictured: the Forbidden City in Beijing

In London, the satellite data that was used to create the map even picks up details like the shape of bridges and boats on the Thames
To find your home on the map, or explore anywhere else in the world, all you need to do is search in the ‘input address’ bar at the top of the map.
The database will then reveal a 3D model of any area in the world, using data recorded by orbiting satellites.
These 3D models are exceptionally accurate in urban areas, where the researchers say the resolution is 30 times finer than comparable databases.
The researchers say that their site has received over 280,000 visits since it launched a few days ago.
This unexpected popularity far exceeds what the site was built for, so the map may be slow to load at times.
Besides being fascinating to explore, this detailed map has an important scientific function.
Creating detailed maps of the world’s buildings has been extremely difficult in the past because it requires specialised satellites to scan the ground with lasers.
This makes it challenging to cover the entire globe with scans that have a high enough fidelity.

Creating detailed maps of the world’s buildings has been extremely difficult in the past because it requires specialised satellites to scan the ground with lasers. Pictured: New York’s towering skyscrapers

Besides being fascinating to explore, this detailed map has an important scientific function. Pictured: the exact layout of the animal enclosures inside Edinburgh Zoo

Here you can see the tall buildings of London’s Canary Wharf financial district and the iconic shape of the O2 stadium

The map doesn’t just record modern structures. Here you can see the layout of the different walls of the Tower of London
The researchers’ solution was to combine laser-scanning data with artificial intelligence to fill out the gaps in the map.
The result is a detailed map of the world that can be used to study development, prepare for disasters, and plan new city developments.
According to their analysis of the dataset, Asia is home to 1.22 billion buildings, almost half of the world’s total supply of buildings.
Africa follows with around 540 million buildings, coming in ahead of Europe with 403 million buildings.
North and South America have significantly fewer buildings, with 295 million and 264 million buildings respectively, while Oceania has only 14 million.
Using that data, the researchers have even created a new way of measuring social and economic development: building volume per capita.
The general idea is that the more space there is per person, the more well off that country is likely to be.
Finland, for example, tops the leaderboard in Europe with over 3,900 cubic metres of building volume per person and regularly ranks as the happiest country in Europe.

By zooming out, you can see the distribution of building volume over the whole world. Red areas show towns and cities where the concentration of buildings is highest

Asia is home to 1.22 billion buildings, almost half the world’s total. This image shows the towering skyline of Shanghai’s Bund district

The map doesn’t only show cities, and the satellite data is sensitive enough to pick up tiny settlements like the town of Lajamanu, deep in Australia’s Northern Territories

The researchers found that Finland, which is often rated as the happiest country in the world, has over six times more building volume per person than Greece and hundreds of times more than many African nations
Greece, on the other hand, which has faced decades of economic stagnation, has six times less building volume per person.
In the future, the researchers hope that this data could be used to help plan additional housing or public facilities in areas that need it most.
At the same time, the model could also be extremely useful for disaster prevention by showing which areas are the most at risk.
The German Aerospace Center, for example, is already examining how it can use the GlobalBuildingAtlas as part of its disaster support work around the world.


